 Close
CloseCoastal Flood Mapping Project
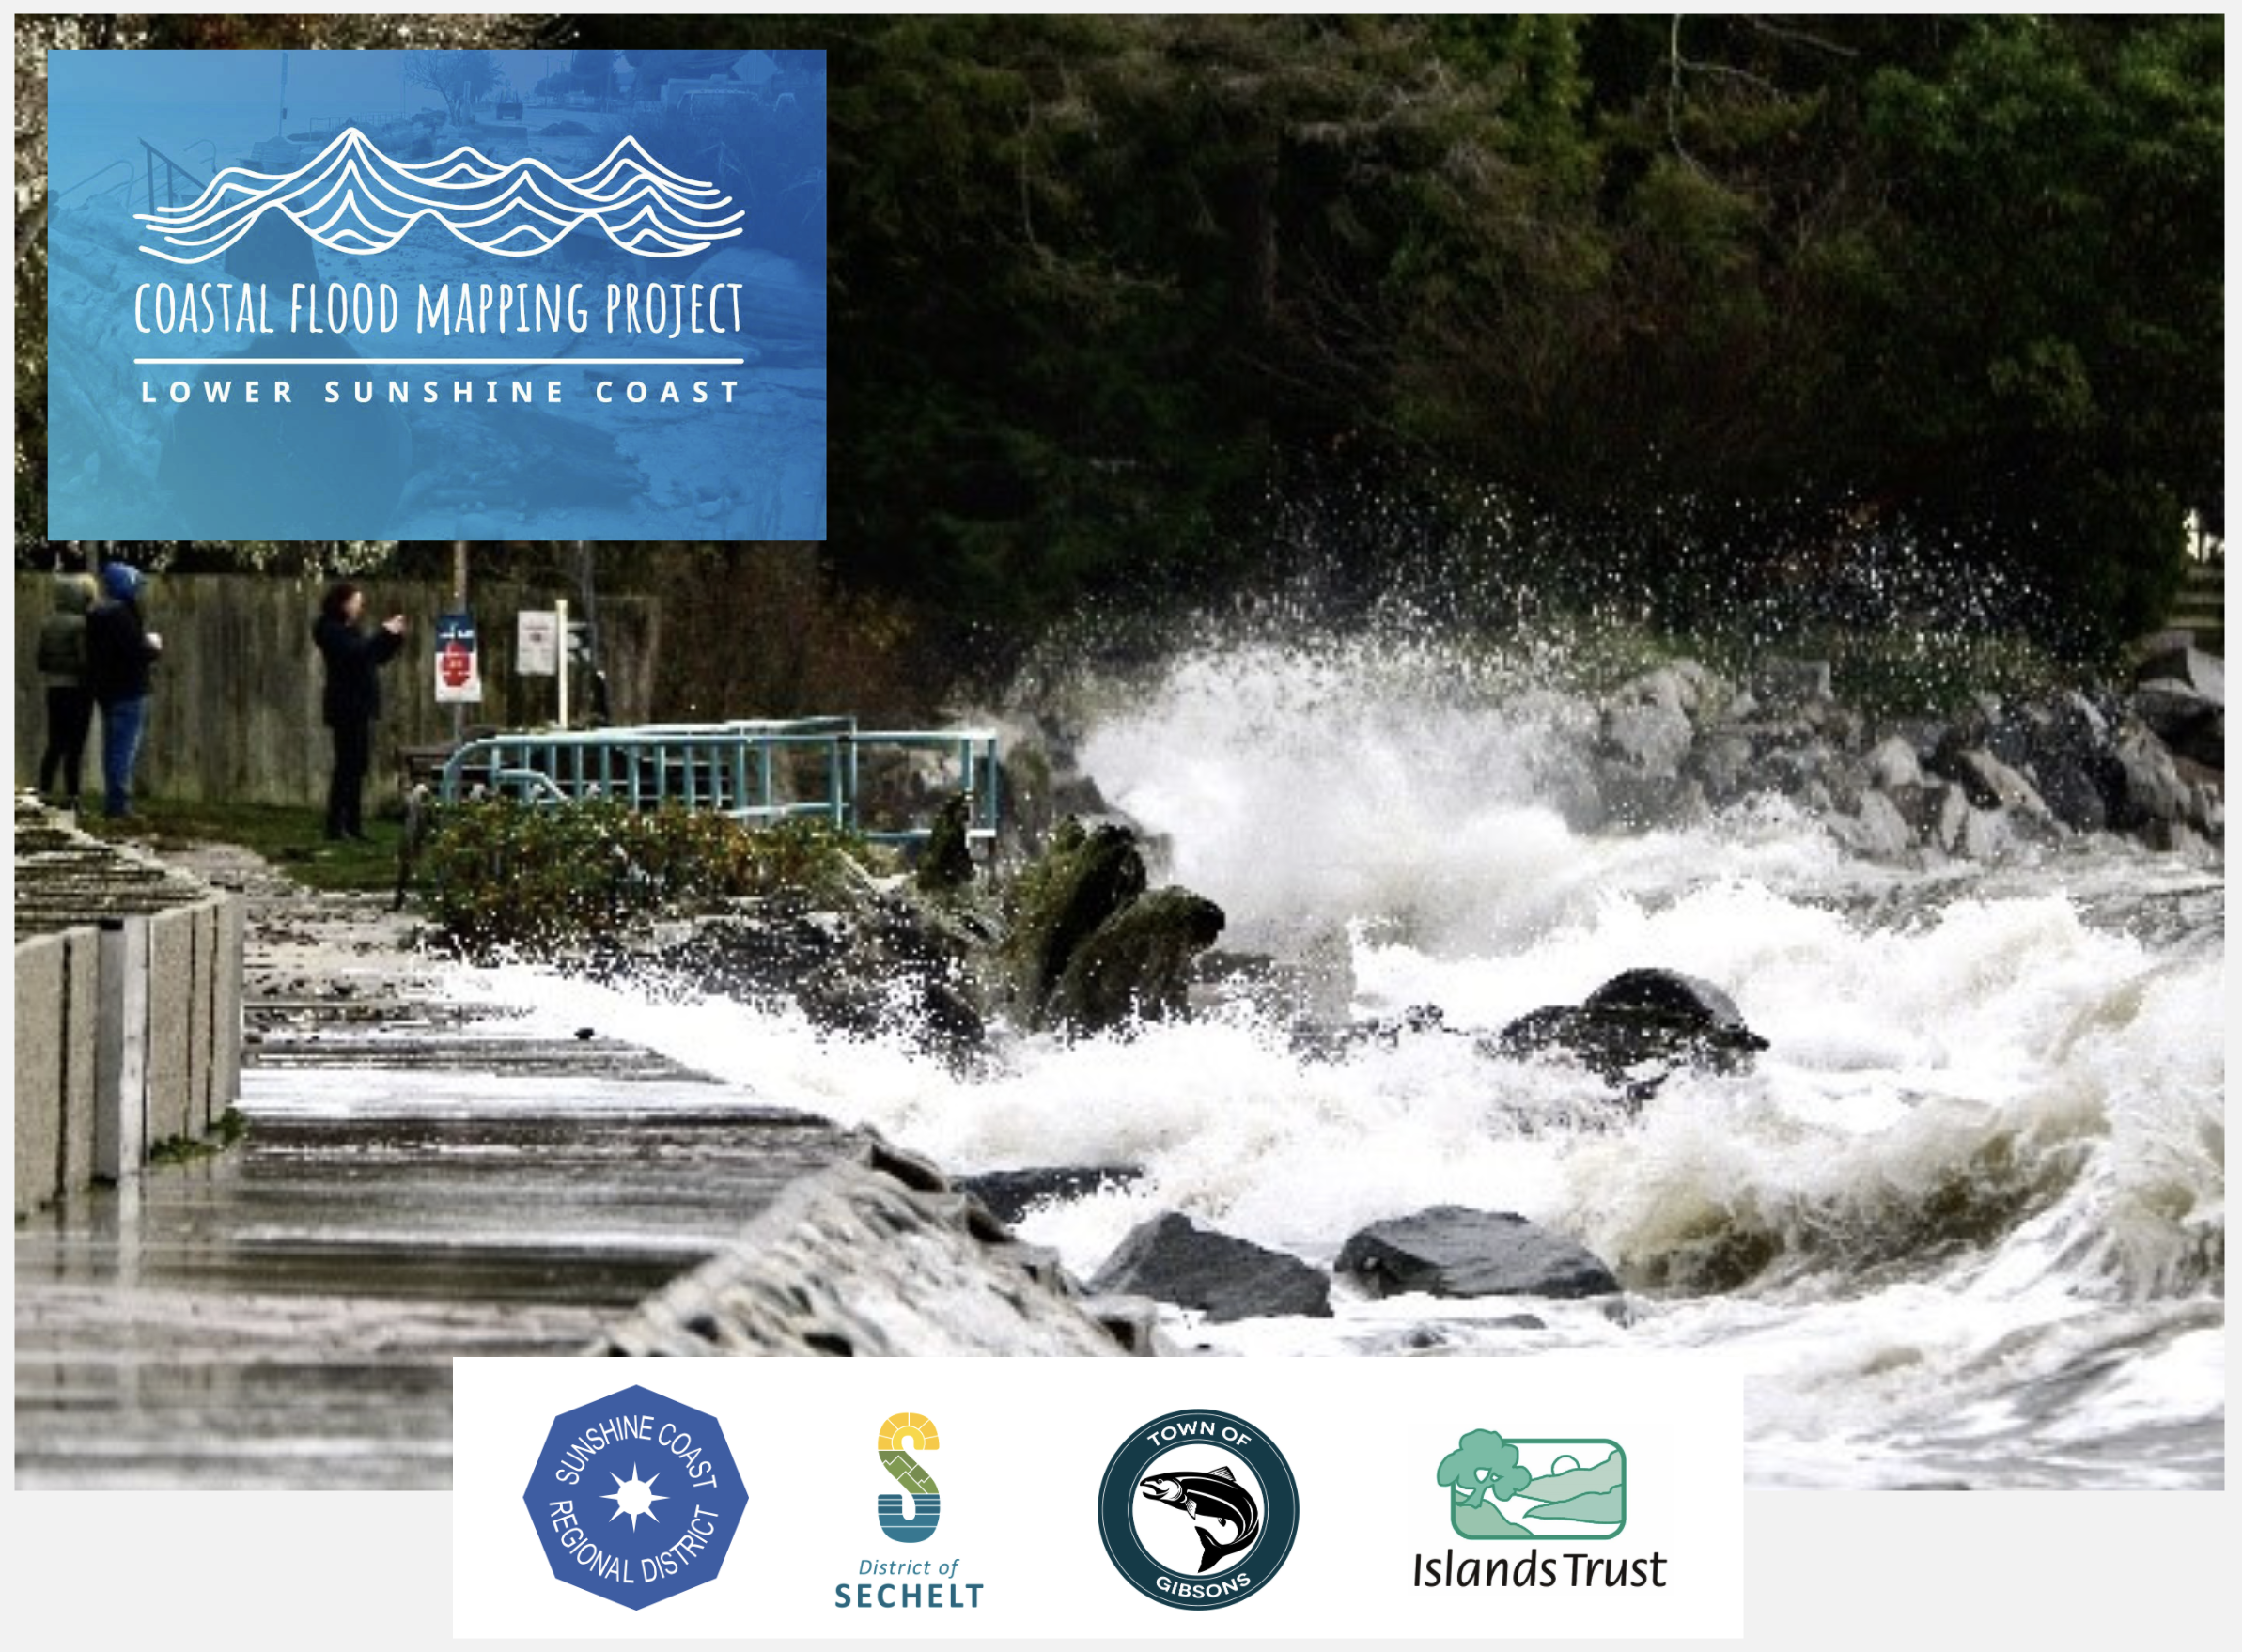
This project provides a detailed look into future flood risks
This collaborative mapping project included the Sunshine Coast Regional District, Town of Gibsons, District of Sechelt and Islands Trust. It began in July 2024 and was completed in October 2025.
The project provides essential data to better understand coastal flooding hazards. The three main components were:
-
- Coastal flood management policy brief focusing on high level land use planning recommendations
- Coastal flooding maps for the Sunshine Coast under different scenarios
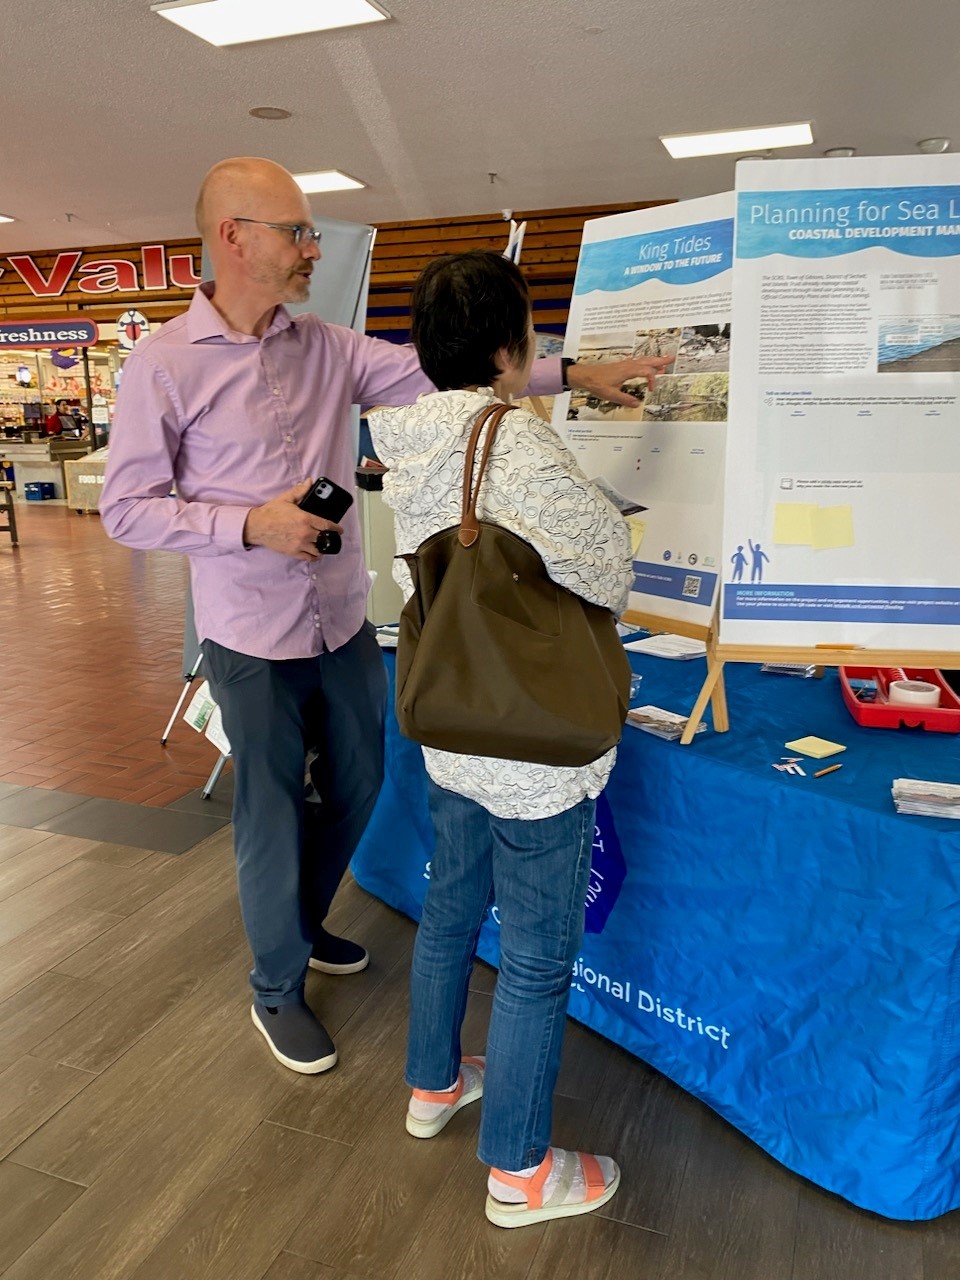
- Preliminary community outreach and engagement on coastal flooding
Collapse
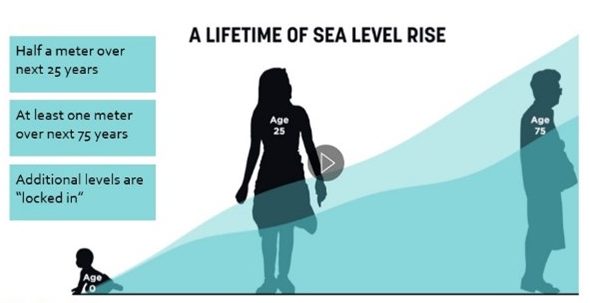
Sea level is rising
- Sea level rise is happening and will continue into our great grandchildren’s lives, increasing coastal flooding impacts, and the need for planning to reduce future costs and impacts.
- While timing is uncertain, today’s King Tides are expected to be our regular daily tides by 2050.
There is time to adapt if we begin now
- Cutting carbon pollution will slow the rate of sea level rise but will not stop the rise before 2100.
- The sooner we adapt, the more resilient our communities become.
We all have a role to play
- Local governments can improve existing policies and regulations for development near coastal flood plains
- Homeowners, businesses and local institutions should inform themselves of coastal flood hazards near their properties. See resource links below.
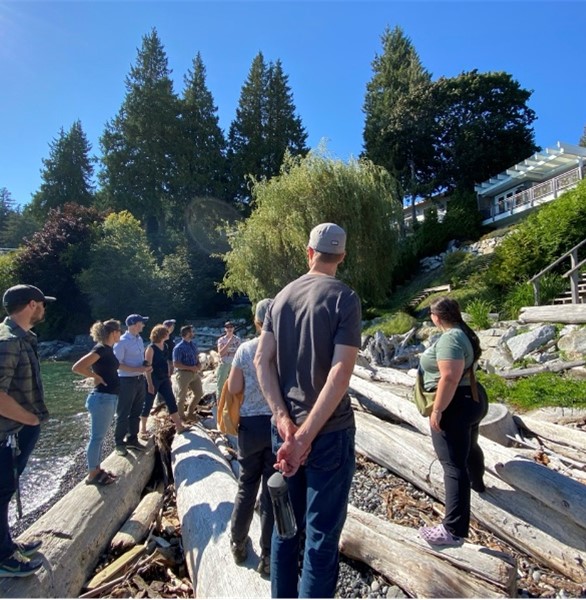
- The SCRD is hosting a GreenShores Workshop November 2025. Contact us for details.
Project Outcomes
The project maps identify vulnerable parts of our coast line which helps inform emergency preparedness for owners and local agencies. The flood data also identifies local government infrastructure that can be made more resilient. The policy brief shows ways for local government to improve and better align policy regionally, and informs the Official Community Plan renewal projects underway in our communities.
We encourage all Sunshine Coast residents to familiarize themselves with the 3 types of maps available via the SCRD Map Viewer, and the Resources links provided below.
How to view Flood Maps on the SCRD Map Viewer
the Coastal Flooding Maps are available on the SCRD interactive map. Please read the Frequently Asked Questions at the bottom of the page to better understand what the different lines mean.
Coastal Flood Maps
Learn more about the three types of maps available on the SCRD map viewer below.
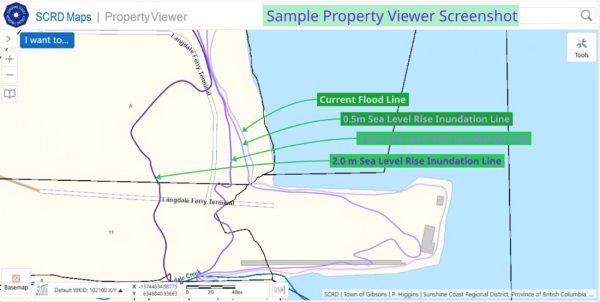
These show where water would be during a high tide and storm surge with different amount of sea level rise. Four lines are showing: Current sea level (light purple), and then 3 lines showing 0.5m ,1.0m, and 2.0m sea level rise (from purple to dark purple).
In some areas, such as parts of Sechelt Village and small areas of the Langdale ferry terminal, a high coastal area protects a low-lying inland area. A breach in the coastal high point would result in broader flooding.
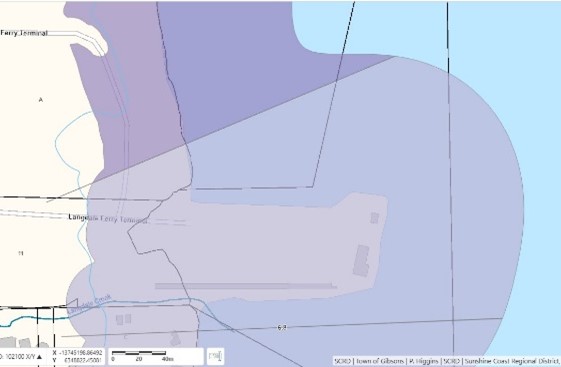
To determine the future minimum required floor height for new construction, these maps show two related but different water levels. In parts of the coast, the pale blue line (Design Water Level + Freeboard) is the safest measure of minimum floor height for construction.
This is especially true in low-lying areas that might flood from still water, even if they’re protected from waves. In other parts, wave effects significantly affect how high water levels can go. The Purple Shaded Areas (Design Water Level + Wave Effects + Freeboard) show the extended hazard zone where waves make the required floor height even higher and further inland. The most conservative measure for future FCL level would be the highest line of these two in a given area.
Neither line is adopted in regulation. Each local government has Development Permit Areas that regulate coastline development.
For more information see the technical report, and the Provincial Flood Hazard Area Land Use Management Guidelines below.
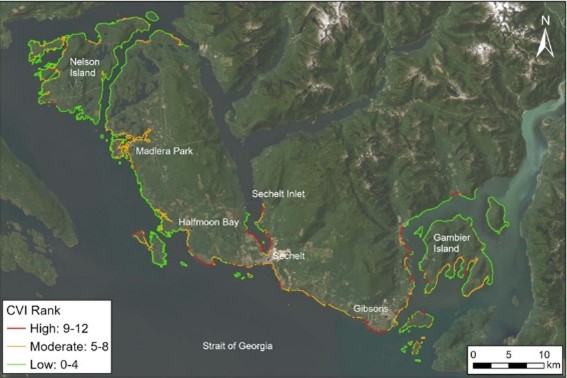
This map shows the risk of erosion from coastal flooding and storm events along our shorelines. This is affected by beach composition, existing shoreline protection, slope and geomorphology. The greenshores program supports resilient shorelines and minimizes the environmental impacts of hard armoring.
Sharing Information and Reviewing Related Plans
SCRD is now communicating key information to local governments and other agencies, and sharing information with communities through upcoming OCP communications, and neighborhood association meetings.
SCRD staff are planning a Fall GreenShores Workshop. Staff are also reviewing potential impacts to SCRD infrastructure and reviewing emergency preparedness plans.
Project data can be applied to a near future risk assessment to inform risk-based planning (a best practice).
Frequently Asked Questions
The 22 questions listed below are divided into three areas:
- What was the study about (Q1-8),
- What do the map lines say (Q9-14), and
- How can I prepare/adapt? (Q15-22)
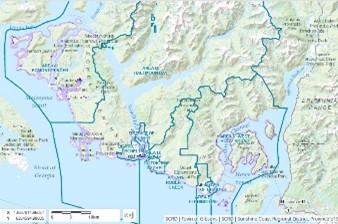
The Lower Sunshine Coast is defined by its proximity to the ocean. With over 500 kilometers (about 310 miles) of coastline, flooding from sea level rise and increased storm wave action is a growing hazard facing the region.
This project aimed to better understand what areas would be impacted by coastal flooding in the short and long term and develop policy recommendations on how to improve our regulations.
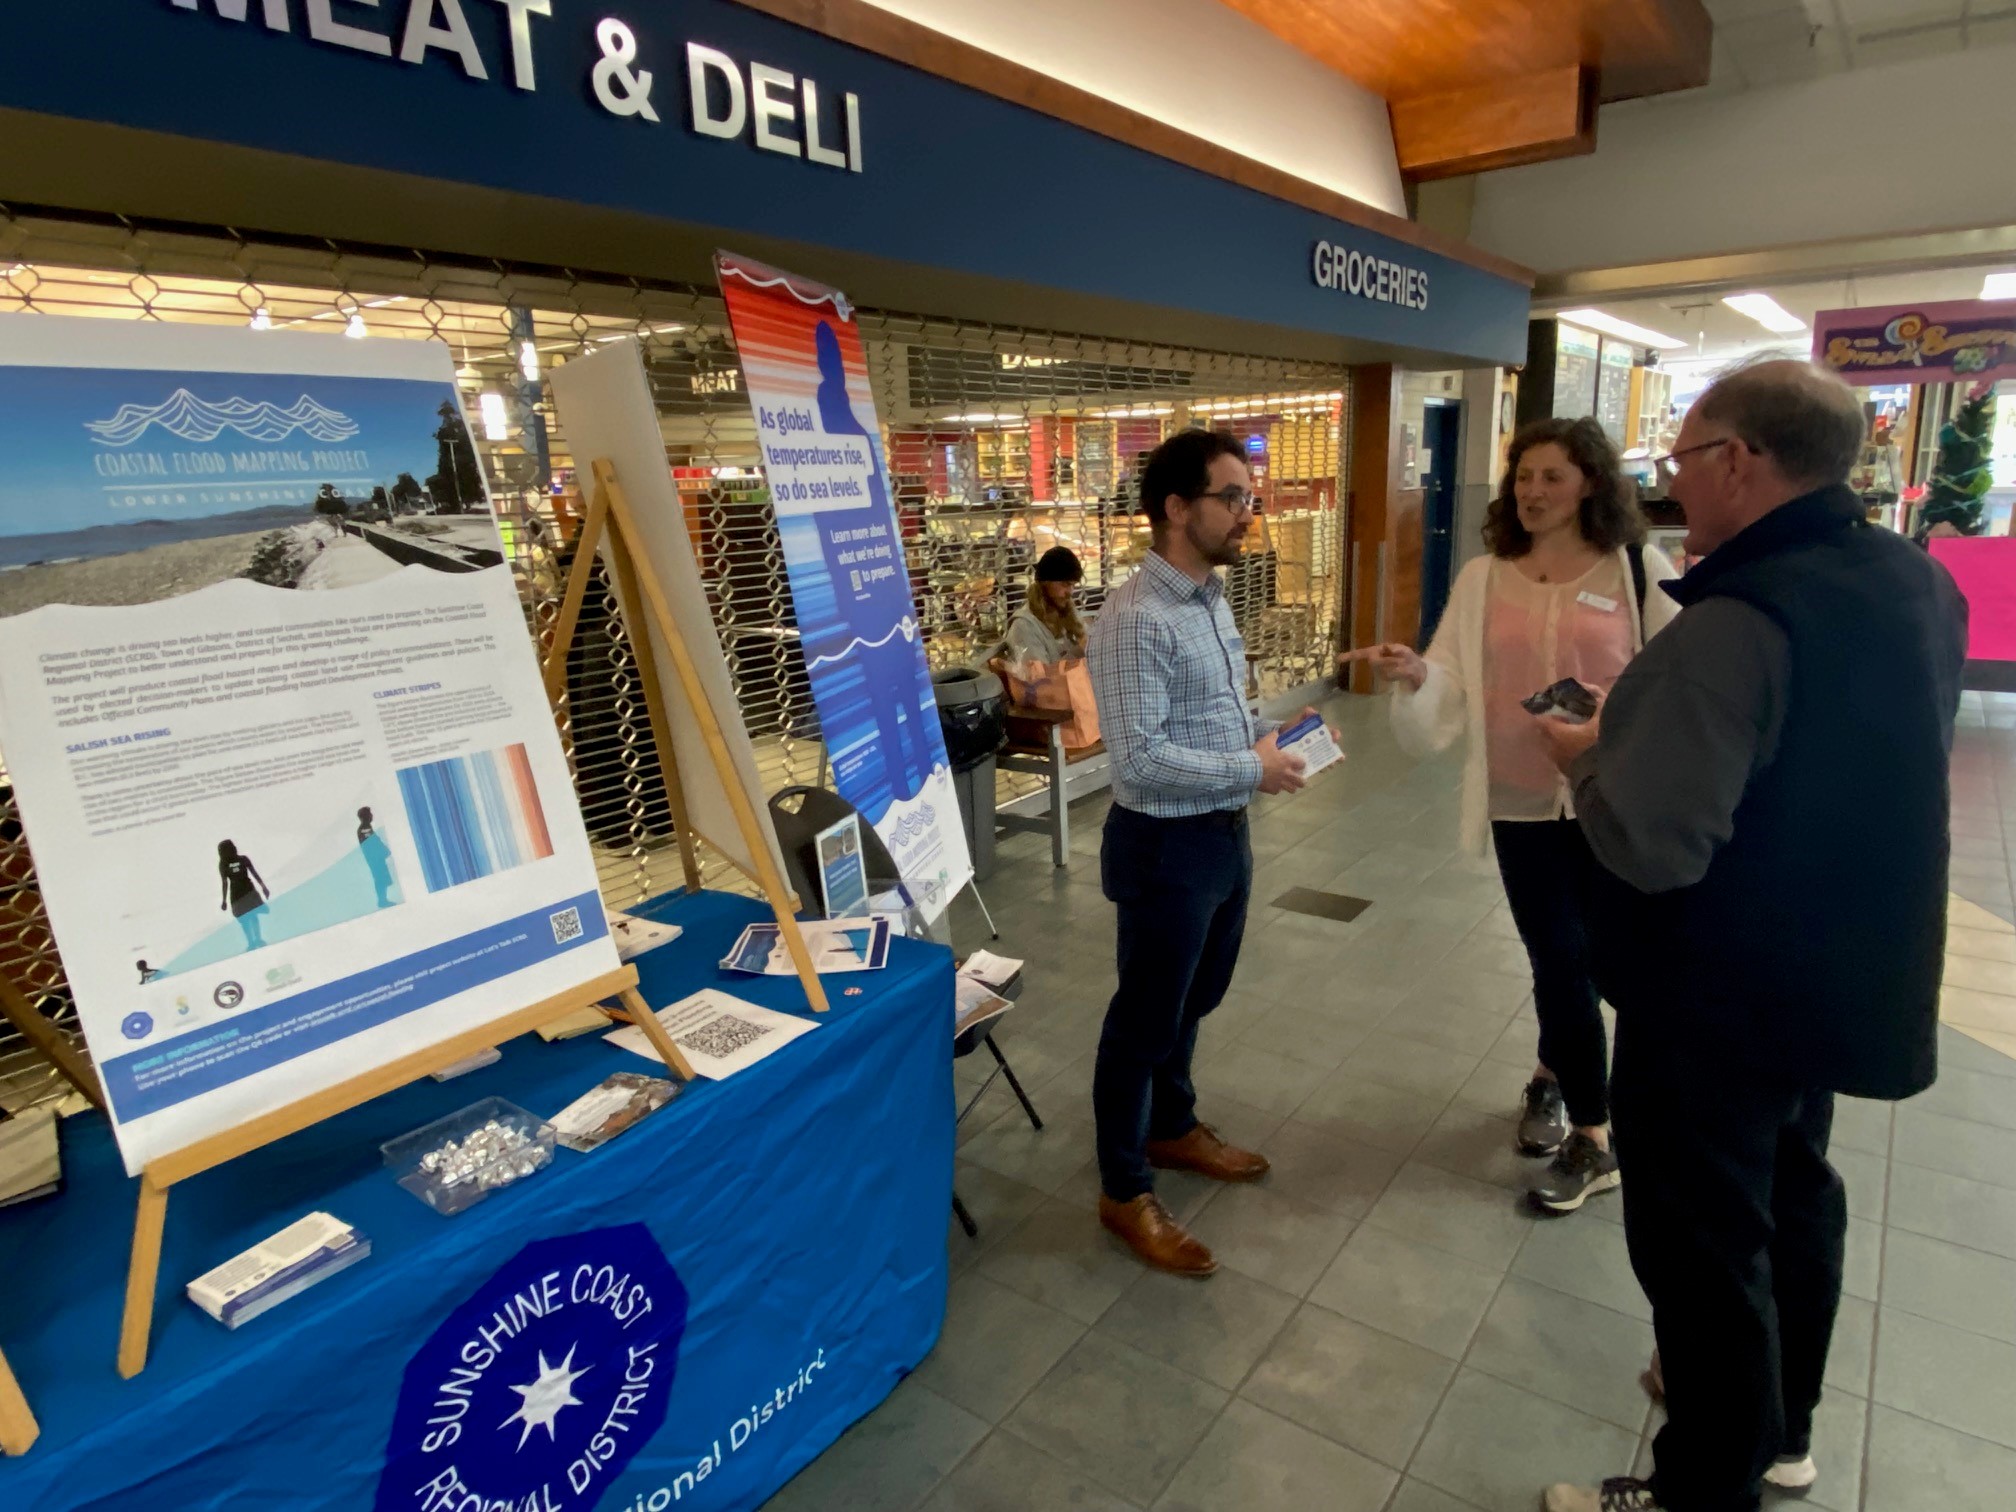
Working together; the Sunshine Coast Regional District (SCRD), Town of Gibsons, District of Sechelt and the Islands Trust, launched the Coastal Flood Mapping project to better understand current and future flood hazards and to better inform land use planning. Northwest Hydraulic Consultants Ltd. (NHC) and sub-consultant EcoPlan International (EcoPlan) completed the project.
The project updated coastal flood hazard mapping for a range of future sea level rise scenarios and developed recommendations for development along the coast.
Experts gathered existing information, reviewed the latest scientific data, and surveyed several coastal areas to create a model for waves and sea level rise on the Sunshine Coast.
This model was used to create maps that help us understand how coastal flooding will impact the coast.
A policy report was also completed. It involved reviewing existing policies and developing recommendations based on best practices on how to improve and align land use planning and policies.
Better understanding current and future flood hazards will help our communities to consider climate adaptation options to address them. Flood mapping also helps inform the region’s land use planning changes to support community resilience.
All local governments already regulate development in coastal areas. Five key action areas were identified for improvement:
- Prioritize coastal hazard development permit areas updates.
- Mainstream coastal flood adaptation, by linking and integrating adaptation, mitigation, and resilience across updated planning policy documents
- Elevate coastal adaptation and resilience in updated Official Community Plans (OCP) by grounding updates in an adaptive management approach that is flexible and responsive as new information emerges
- Enhance awareness and education within OCPs by sharing, illustrating, and explaining key concepts and information
- Consistent and clear policy – by seeking regionally consistent Development Permit Areas (DPA) guidance and definitions.
The project created different maps.
Inundation maps represent projected flood extent during a high tide and surge event. Four sea level rise scenarios were selected at 0, 0.5, 1 and 2 metres. 0 metres of sea level rise represents the present day while 1 metre of sea level rise is the Provincial guideline for the year 2100.
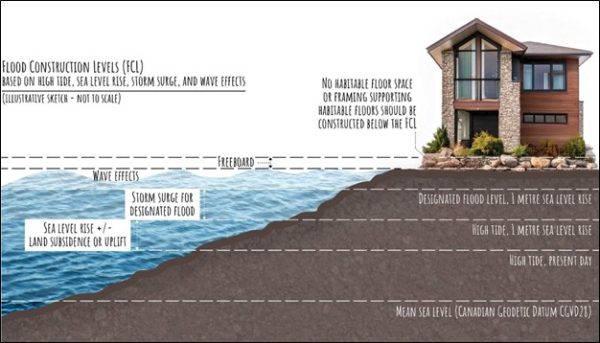
- Flood Construction Levels (FCL) represent the height above which a living space should be built. It is delineated by combining storm surge, high tide, wind and wave effect, sea level rise, and freeboard (or safety buffer).
An FCL was set at approximately every 250 metres of coastline. These lines were then connected via shoreline elevation. There is variability between different FCL levels due to a variety of factors such as angle of wave action and shoreline composition. For example, a hardened shore with rip rap will produce higher waves and flooding than a gradual shoreline with vegetation and structural features that can dissipate wave energy. This means changes to shoreline will impact the actual flood construction level.
Also important is to note that in some areas where wave effect is blocked by a high coastal feature such as Sechelt Village, the proper Flood Construction Level to use is determined by the more conservative design water level with one meter of sea level rise and freeboard.
- Coastal Vulnerability Index (CVI) represents the coastline’s vulnerability to erosion from rising sea levels and storms.
Different maps serve different purposes. Coastal vulnerability index and inundation maps for 0.5 metres of sea level rise inform adaptation for existing infrastructure and ecosystems. Inundation maps with higher sea level rise inform long term adaptation and community planning. Flood Construction Level maps inform development by indicating limits above which living spaces should be constructed. These maps are not yet incorporated into regulatory tools.
The furthest inland point that ocean water reaches on average high tide. The highest elevation where tidal high water regularly covers the shore. On a given day Pacific coastlines typically experience two low tides, and two high tides, one of which is the ‘high high tide’. This is the highest tide in an area.
No. It indicates the highest elevation water reaches during high tide. The water then recedes like regular tides.
A flood construction level (FCL) is the minimum elevation to which a building’s habitable areas, such as the lowest floor or a concrete slab, must be built to protect it from flood damage. FCLs are determined on a site-specific basis, usually by a qualified professional engineer. The calculation includes the forecast flood level, a specific level of high tide for a storm scenario, and the freeboard, an added height to create a safety margin to minimize risk of damage to the building.
An abnormal rise of water caused by storm winds and low atmospheric pressure. It is a mass of water pushed towards the coast, not just a series of waves.
The increase in the average height of the world’s oceans. It is caused by melting glaciers and the expansion of the ocean’s waters as they warm up. This long-term trend, primarily caused by human-driven climate change, threatens coastal communities globally. While the sea level has fluctuated naturally throughout Earth’s history, the current rate of rise is unprecedented in modern times.
These are actions that protect, sustainably manage, or restore ecosystems to address societal challenges effectively while providing human well-being and biodiversity benefits. Instead of relying on “hard” or “grey” infrastructure like concrete seawalls, nature-based solutions work with nature’s own systems to achieve the same goals. See www.scrd.ca/climate for information on the Greenshores program that provides guidelines on adapting shoreline properties to sea-level rise and increased storm surge.
The online digital tool https://maps.scrd.ca/ allows you to view properties and where they are in relation to forecast future high tide lines.
The mapping layers are under the Environment menu, Coastal Flood Mapping. This will show four purple lines along the coastal parts of the sunshine coast. The lightest purple line is the ‘current flood line’. Each of the progressively darker lines indicate the projected coastal flood plain line for 0.5m, 1.0m, and 2.0m sea level rise scenarios. The 0.5m Inundation line shows the earliest forecast for sea level rise high waters.
The FCL maps affect development or redevelopment. Each local government has existing regulations called Development Permit Areas that outline requirements or guidelines relating to FCL. An existing home that is below the new FCL high tide flood line will not require changes to the foundation.
There is uncertainty as to exactly when this will happen, but there is certainty it will happen. One way to imagine potential impacts is to look at the king tide levels of today. The king tide today is expected to be the regular high tide in 2050. Additionally, Provincial guidelines are to prepare for one metre of sea level rise by 2100.
There are steps you can take if your home is already susceptible to floods in recent years. These are available through:
- PreparedBC’s resources: https://www2.gov.bc.ca/assets/gov/public-safety-and-emergency-services/emergency-preparedness-response-recovery/embc/preparedbc/preparedbc-guides/preparedbc_flood_preparedness_guide_fillable.pdf
- Stay Informed: Look for king tide forecasts. Sign up for weather alerts from Environment Canada. Follow local media and social media accounts for emergency information.
- Information Session: You may wish to request an information session locally through your Neighborhood Association.
- Professional Assessment: You can request an assessment from a qualified professional such as an engineer with coastal expertise.
Consult a geotechnical engineer and/or floodproofing specialists to determine the best options to protect your property short term.
This link to provincial flooding guidelines can help get you started https://www2.gov.bc.ca/gov/content/safety/emergency-management/preparedbc/know-your-hazards/floods/before-flood
The Fraser Basin Council’s Floodwise resources and guidelines are another valuable resource: https://floodwise.ca/
Insurance companies have been integrating climate change into their assessments for some time. Contact your insurance provider to discuss your coverage for coastal flooding and storm surges.
Protecting septic fields from coastal flooding requires contacting a qualified professional for assessment and potential repairs and upgrades.
The BC Sewerage System regulation is the primary source of guidance.
We recommend you consult with local health authorities (Vancouver Coastal Health) and registered onsite wastewater practitioners to understand specific requirements and options. A good starting place is VCH’s Sewerage Systems Property Owners Q&A.
Solutions might include upgrading to more advanced septic systems designed for challenging conditions, proper system maintenance, and ensuring the proper functioning of the system.
The SCRD and local municipalities will provide interactive flood hazard maps online as impacts of rising sea levels will vary by property and location. We will share best practices and guidelines and links to specialists that can provide site-specific advice.
We are helping our communities understand short term versus long term impacts of coastal flooding and how to integrate this information into our Official Community Plans and our Zoning Bylaws. The SCRD is working to support necessary adaptations to its infrastructure to help maintain community services.
The first step to becoming more resilient is better understanding the hazard. This study was conducted to understand what long-term changes are expected on the coast. Local governments are using this information in their risk assessments for infrastructure and services. Coastal flooding hazards are being integrated into several projects such as the Official Community Plan renewal and the Sunshine Coast Emergency Program
Get in touch!
Interested in having a Neighbourhood/ Community Association presentation in your area? A 1.5-2 hour information workshop with Q&A can be provided. Contact Raph Shay at raph.shay@scrd.ca or Johan Stroman at johan.stroman@scrd.ca to schedule a session.